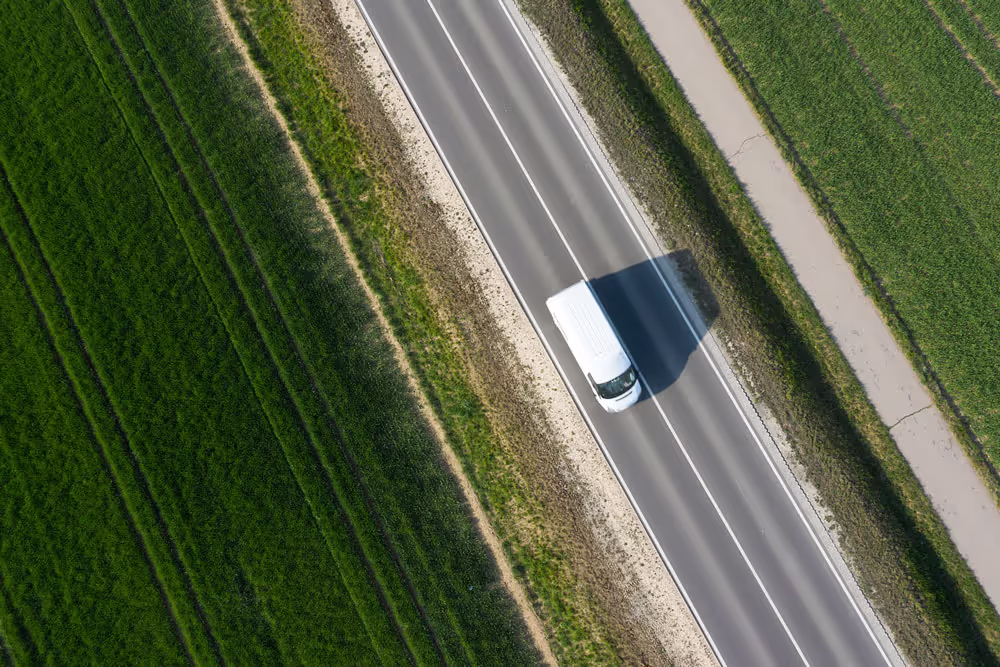
Safe, efficient, & on-time services
Trust Driver•i® for your fleet safety and management solutions.


Achieve a higher level of customer satisfaction
Quickly see the location of your vehicles, how safe your drivers are and deliver accurate ETAs so you exceed customer expectations.
Lower operational costs
Easily manage and control vehicle maintenance, fuel consumption, tracking and productivity without compromising your service standards.
Ensure the safety of your assets
Mitigate risk with AI-powered in-cab alerts to keep drivers engaged throughout their trip, vehicles in service longer, and packages secure before they are delivered.
Quick & easy setup
A support team that you can count on to keep your fleet running smoothly and your day-to-day tasks streamlined so you can maximize fleet operations.
What our customers are saying
"I like the fact that the system recognizes when a vehicle cuts over in front of my driver and creates the event. So, then it gets categorized as, ‘Hey, this is the other vehicle's fault.” 95% of the time we've been exonerated from [an] accident...[because] thankfully with our dash cams, we were able to show to the officer on the scene [that the other person was at fault]. Those are the things that I really like that Netradyne offers."
Simplify fleet management
Streamline safety and operational tasks with Netradyne's easy to use portal and mobile app.
Live fleet GPS tracking
Track and manage your fleet with powerful geofence management, routing, dispatch and two-way messaging, risk management analysis, and trip history details.


Deeper insights into fuel usage
Easily identify vehicle inefficiencies, watch for fuel theft and proactively manage one of your biggest expense items. Apply this information to determine smarter routes and focused driver coaching sessions.
Optimize fleet maintenance
Identify and address maintenance issues before they impact performance and use the Preventative Maintenance Automation feature to set maintenance intervals using odometer or engine hours read directly from the vehicle.


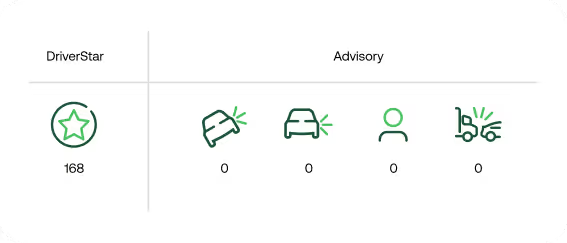

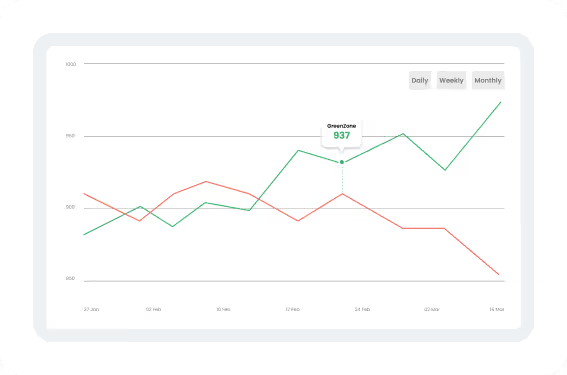
Automate positive coaching
With a more comprehensive view into performance metrics using Netradyne's GreenZone Score, you can immediately identify your highest and lowest performing drivers to better tailor coaching and positive recognition at the individual level.
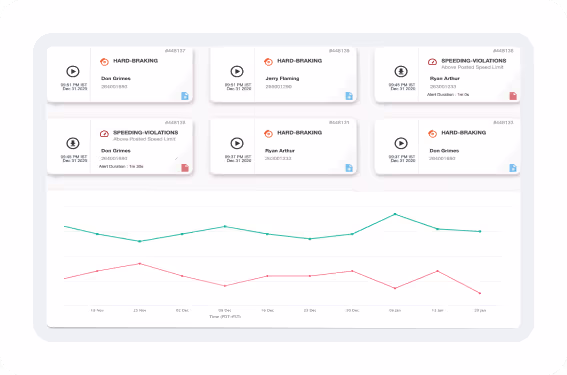
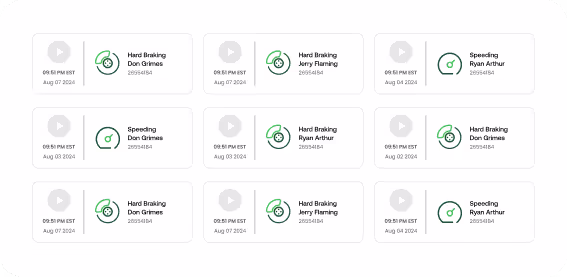
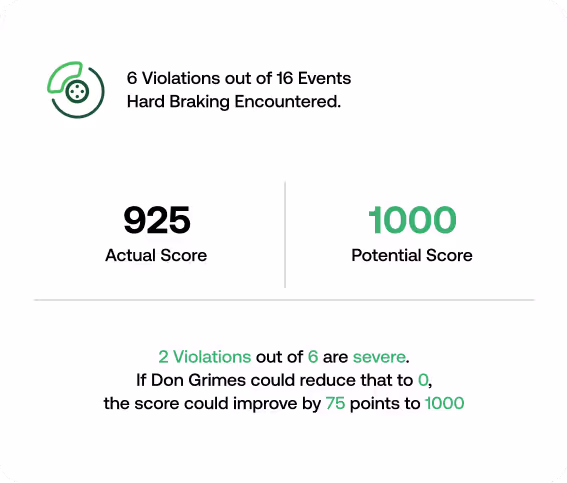
Reduce claims
Access to relevant video evidence to quickly resolve claims and exonerate drivers. With Netradyne, you have an extra set of eyes on the road for complete visibility, in high resolution, so you can quickly and easily find what you need.


Frictionless coaching
Dependable data from Driver•i® helps you tailor your coaching and training sessions. Driver self-coaching through the Driver•i Mobile App is an easy way to automate coaching sessions, keeping drivers engaged in road safety.
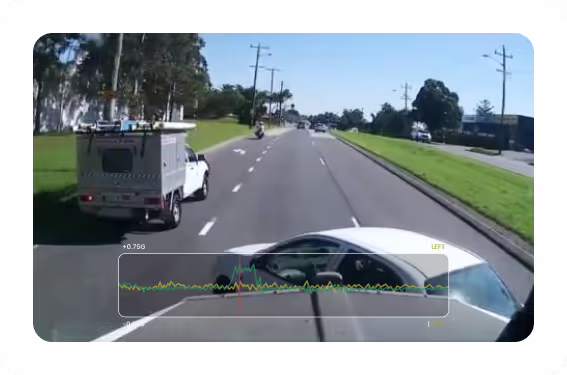
In-depth vehicle insight
Get instant visibility into any situation with live vehicle location and a multi-camera view in and around the vehicle. Check speed, engine status, and other key vehicle telematics data with ease.


Boost safety awareness
Confidently manage your fleet and drivers by transforming your data into insights that benefit your business in the long run. Real-time risk management with 100% of driving time captured and analyzed to ensure your drivers are safe on the road.
Netradyne's Driver•i captures and analyzes 100% of driving time providing video footage to help exonerate drivers and prove delivery and service, automated recognition and rewarding of safe and proactive driving habits, and real-time alerts to help keep drivers engaged and attentive throughout their trip. The Driver•i Mobile App empowers drivers to be autonomous for their own driving behaviors that impact their GreenZone® Score.
Managers gain full visibility into what is happening in and around their vehicles. Through the Driver•i dashboard, fleet and safety managers can quickly access and track driver GreenZone scores and receive notifications about risky and safe driving behavior in real-time, advocating for their drivers. The Driver•i Mobile App enables managers to coach drivers virtually and share critical event footage to exonerate drivers.
Yes, you can choose between the 2-lens Driver•i or the 4-lens Driver•i coupled with the Driver•i Hub-X which enables support of up to 4 additional cameras, greatly reducing blind spots. The system also supports an in-cab monitor so drivers have a clear view of all of the cameras together.
Netradyne’s Driver•i is an extra set of eyes on the road for drivers and managers. Video footage provides proof to fight false claims and avoid collisions and litigation.
Yes, the GreenZone Score can be increased when drivers exhibit safe and proactive driving behaviors. There is a correlation between a driver's GreenZone Score and their collision rate. Data shows that a 50-point increase in GreenZone score equates to 13-15% decrease in collision rates. Both drivers and managers can view the score and see what areas need additional training for improvement.


Want to protect drivers & reduce costs?
That’s not a trick question. See for yourself with a demo.