What is your GreenZone® Score?
A fundamentally different approach to advocating for drivers, Netradyne's GreenZone Score is the industry's first driver score that publishes both safe and risky driving behaviors.


Unlock a faster path to ROI, collision reduction & safer roads
A scientific approach to leveraging large amounts of fleet and driver data in a calculation that is an accurate reflection of what is happening in the field. You can trust and easily explain the score, see a decrease in collisions, and an increase in safe driving habits.
Positive reinforcement
With a focus on what drivers did well, you can rest easy that your drivers and fleet are safely in the GreenZone. Driver•i® plus this rolling score reflect a driver’s entire workday, mitigate any guesswork and focus on the positive.
DriverStars
Drivers earn points for proactive, safe driving behaviors like complying with stop signs, maintaining safe following distance, remaining attentive throughout their trip, and not speeding.
Performance insights
With complete visibility into how events and alerts impact the score, you can better explain a driver's score resulting in a more efficient and impactful coaching session - drivers are more at ease with the data.
Correlation to risk
Reporting tools to help you gain deeper insights into the correlation between a driver's GreenZone Score and their collision rate.
Holistic view
With the flexibility for you to view the data as you need it, you can better inform incentive programs, business decisions and future projections.
Gamification
Give drivers a competitive edge and increase driver engagement with friendly competition. Drivers take accountability for their driving behaviors and appreciate the complete transparency to their performance data via the Driver•i Mobile App.
What our customers are saying
"There is a clear connection between low scores and accident frequency; the GreenZone® score is an excellent indicator of risk. I believe wholeheartedly in the DriverStar Streaks, especially the 25 consecutive stops, 50 stops consecutive, 75 stop sign stops consecutive. Truck drivers love stats, it's no different than when we were all kids collecting baseball cards."
"At the end of the day, Netradyne gives us the best possible avenue to educate our drivers and empower a safer fleet."
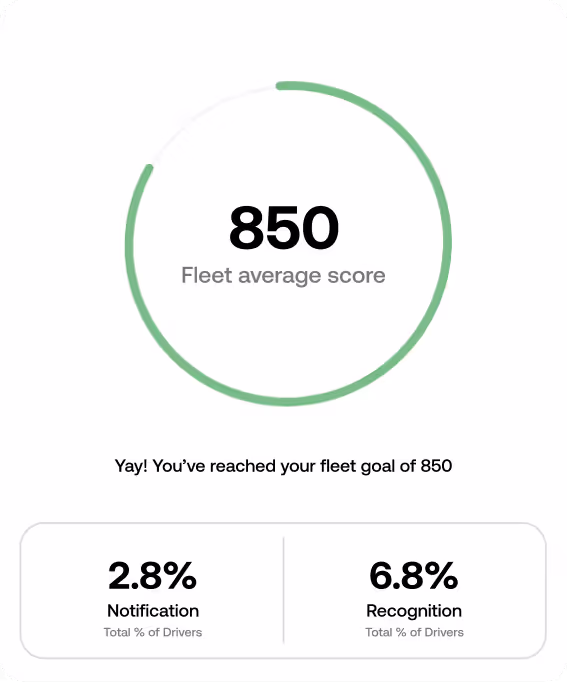
Safety, quantified
Increase driver retention
Confidently manage your fleet and drivers. The GreenZone Score provides an accurate and fair structure for bonuses and rewards as well as a clear view into which behaviors need to be addressed to increase road safety.


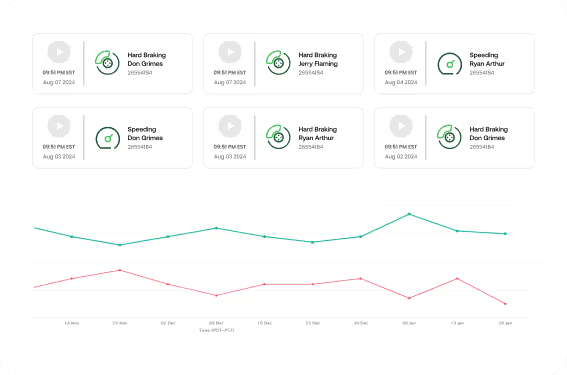


Relevant representation of risk
With even more event and alert details at your fingertips, you can gain clearer insight into driver performance with the GreenZone Score. This score updates in real time throughout the driving day providing an accurate and holistic view of your drivers and fleet as a whole.
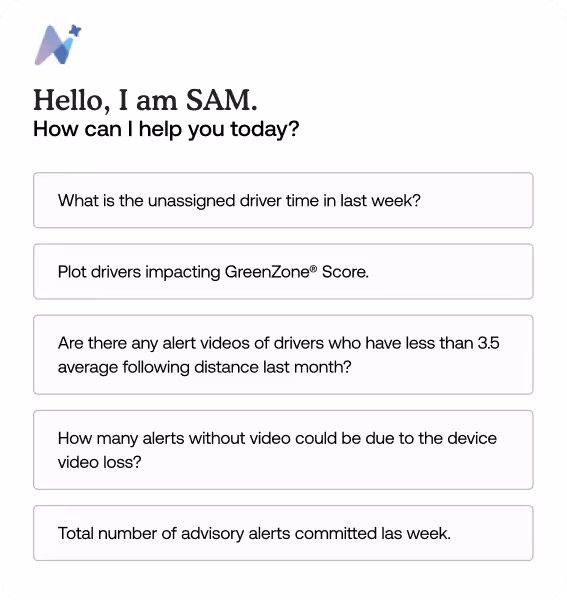
Simplify & focus coaching sessions
With a more comprehensive itemized view into performance metrics, you can immediately identify your highest and lowest performing drivers to better tailor coaching at the individual level. Just ask SAM, Netradyne's Safety Manager Assistant, your AI-powered tool for a quick view.


Boost safety awareness
With an easy-to-understand view of driving behaviors and related impact on the score, drivers are empowered to self-coach and be autonomous. Drivers can review key events and video with accompanying suggestions on how to improve performance and increase their score.
Netradyne's Driver•i uses edge computing to quickly process and analyze large amounts of data from 100% of driving time in real time. This data is converted into personalized driver insights that clearly show where a driver is doing well and where they need to improve. The GreenZone Score is updated throughout the driver's workday. This relevant and accurate reflection of what is happening in the field gives managers peace of mind and the ability to evaluate the performance of their drivers and their fleet.
Yes, the GreenZone score can be increased when drivers exhibit safe and proactive driving behaviors. There is a natural correlation between a driver's GreenZone Score and their collision rate. Data shows that a 50-point increase in GreenZone score equates to 13-15% decrease in collision rates. Both drivers and managers can view the score and see what areas need additional training for improvement.
Managers have trustworthy and relevant data at their fingertips and are easily able to explain the impact of the events generated by a driver to a driver’s score based on the itemized list of driving behaviors and the related impact to the score. With this information at hand, managers and drivers are better enabled to understand the risk profile.

Искате да защитите шофьорите и да намалите разходите?
Това не е трик въпрос. Вижте сами с демонстрация.